|
A Microsoft Excel Reporting Tool Advanced Financial Analyst is a state of the art reporting tool that provides access to your general ledger data directly from Microsoft Excel, the most popular spreadsheet in the world. There are two primary components to Advanced Financial Analyst: Author and Analyst. Use Author to design report templates. Begin with an existing template or start from scratch. Place entire rows and columns of information in the worksheet with user-friendly wizards. Build in filters that allow users to specify report criteria when viewing the report. Add drill down capability to a report by simply checking a box. Or, create a data source to be used in conjunction with Excel pivot tables. Author makes template creation easy thanks to innovative programming that was done using 100% Microsoft tools. Use Analyst to view reports using your templates. Simply open the template, select any filter criteria and run it. The report is automatically generated with new data from the selected period. This means your time is spent analyzing data, not entering it. And, because your data is in Excel, you have a full complement of tools available to you. Perform 'what-if' analysis. Create charts and graphs. Or, distribute the information in native Excel, HTML or text formats. It's all fast and easy because your data is in Excel. |

|
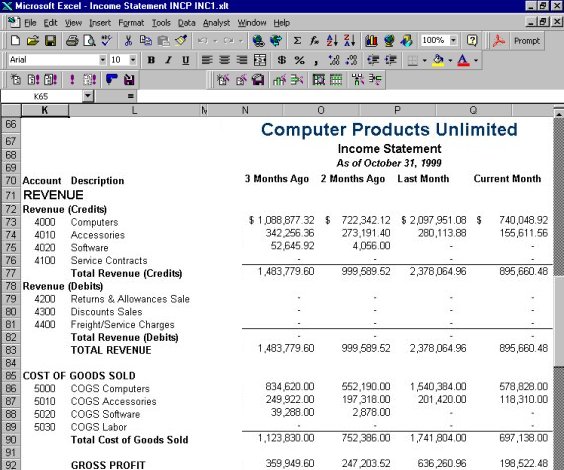
Financial statements are presented directly in MS Excel, where they can be
further manipulated, published to an intranet, emailed to others or included in
MS Word documents.
|
|

Wizards guide you through modifying columns in Author.

Analyze your data using charts in MS Excel.